


Hello, ladies and gentlemen. My name is Kyle Jacobson and I am the newest writer here at Staking the Plains. My Red Raider credentials include a bachelor’s, master’s, and, most importantly, a wife from Texas Tech. I’m excited to be part of this community and hope you enjoy my posts!
Lately, I’ve taken an interest in data and analytics in the realm of college sports for two reasons. First, many programs are using advanced metrics more and more rather than relying on “the eye test” or other outdated methods. Now, there are new systems of analyzing player and team performance, and some of these systems have proven accurate over time. Second, with sports gambling gaining momentum to be legalized across the country, I wanted to see if any of these systems could beat Vegas (of course they can’t in the long run, right?).
So during college football season I created spreadsheet upon spreadsheet, relying on ESPN’s Football Power Index (FPI) to inform me of what Texas Tech’s odds were in individual games as well as using some basic statistics to project their season outlook.
If you happen to follow me on Twitter, you may remember that at one point Texas Tech was 5-2, and based on FPI’s projections for their remaining five games, the Red Raiders had about a 98 percent chance of reaching a bowl game, and looked likely to finish between 7-5 and 9-3. We know how that turned out…
“Well, Kyle, it sounds like ESPN’s FPI is garbage if it was that far off.”
Not so fast, my friend! Before the season started, FPI had Texas Tech as a five or six-win team. That’s where FPI had Tech football pegged for the 2017 season, too. Alas…
ESPN’s FPI was actually the most accurate public model for the 2017 season, and we’ll see how things shake out for this season. Using FPI data, I created a hypothetical gambling system that actually proved profitable for a majority of this season. There were some down weeks, and I didn’t create the system until week three and didn’t finish the season using the system, but it’s still interesting. I’ll talk more about this system later on.
Anyway, I’m about to do the whole thing all over again for this Big 12 basketball season. ESPN also has a Basketball Power Index (BPI), which so far this season has been among the most accurate public models for predicting winners in college basketball games.
More than 2,000 NCAA basketball games have been played this season. ESPN’s BPI has predicted a winner for each of them, and has been correct 78 percent of the time. For reference, the opening line favorite in Las Vegas is at 78.5 percent. That’s pretty dang good.
There are other sound models out there (I like Ken Pomeroy, AKA “KenPom”) that I’ll reference from time to time, but we’ll stick with BPI for simplicity unless it starts becoming unreliable. It’s very accessible, too, as you can check out BPI’s prediction for any given matchup using the ESPN app on your phone.
So, what does BPI say about the Big 12 and Texas Tech before conference play begins? Here’s how the Big 12 stacks up nationally at the moment, including their BPI score – the expected margin of victory over an “average” team on a neutral court:
- Texas Tech, 13.3
- Kansas, 12.9
- Iowa State, 11.8
- Oklahoma, 10
- TCU, 9.2
- Kansas State, 8.3
- Baylor, 7.6
- Texas, 7.6
- West Virginia, 7.3
- Oklahoma State, 2.7
You’re reading that correctly; BPI thinks that Texas Tech is a better basketball team than Kansas right now. Texas Tech’s defensive BPI is best in the country, and their only loss this season is to Duke, who is No. 1 nationally in BPI.
It should be noted that BPI updates daily, so this is soon to be out of date. That’s why I’m here; to update this as the season goes along.
Now let’s take a look at BPI’s predictions for all 18 of Texas Tech’s Big 12 games this season. These are in chronological order with Texas Tech’s percent chance of winning in the right column.
| @ West Virginia | 59.7% |
| Kansas State | 84% |
| Oklahoma | 77.8% |
| @ Texas | 62.7% |
| Iowa State | 75.6% |
| @ Baylor | 62.4% |
| @ Kansas State | 58.4% |
| TCU | 80.8% |
| @ Kansas | 36.1% |
| West Virginia | 88.1% |
| @ Oklahoma | 51.2% |
| @ Oklahoma State | 76.6% |
| Baylor | 85% |
| Kansas | 67.9% |
| Oklahoma State | 93.7% |
| @ TCU | 54.7% |
| Texas | 85.2% |
| @ Iowa State | 39.1% |
Home court advantage averages out to about a 26 percent swing in win probability for Texas Tech in Big 12 play. Quite amazingly, Texas Tech is only slated to be the underdog in two games: at Kansas and at Iowa State.
“Sweet! Texas Tech is going 16-2 this year in the Big 12!”
Well, maybe, but it’s much more likely that they don’t go 16-2. Just because something has greater than a 50 percent chance of happening, doesn’t mean that it is certainly going to happen. Texas Tech is not certain to win any game because they have a 70 or 80 percent chance of winning. Also, they’re not certain to lose a game simply because they only have a 35 percent chance of winning.
If you average out their win probability for each game, it comes out to 68.83 percent. We can use that to calculate the most likely expected outcomes this season. Think of it this way: instead of a coin flip having 50/50 odds, let’s use a weighted coin to make it 69/31 odds that Texas Tech will win each individual Big 12 game. Winning (heads) has a 69 percent chance of happening each time, and losing (tails), has a 31 percent chance of happening. Now let’s “flip the coin” 18 times (one for each Big 12 game) and see what happens…
Below are the possible Big 12 records in the left column, with the probability they occur in the right column. Not all possibilities are listed, as I left off any that had less than a 1 percent chance of happening just to simplify things. A graph of the results is also provided to help you visualize this.
| 16-2 | 3.8% |
| 15-3 | 9.1% |
| 14-4 | 15.5% |
| 13-5 | 19.6% |
| 12-6 | 19.3% |
| 11-7 | 14.9% |
| 10-8 | 9.3% |
| 9-9 | 4.7% |
| 8-10 | 1.9% |
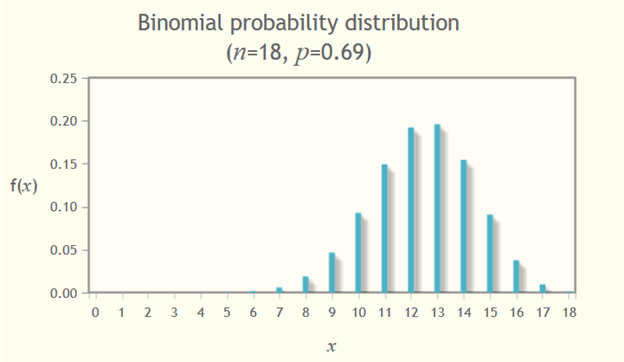
Going back to that 16-2 figure (if Texas Tech won each game it was favored in, and lost each game it was the underdog), it only has a 4 percent chance of happening. Instead, the most likely outcomes are that Texas Tech finishes with either 12 or 13 wins in conference play.
Eight wins usually gets Big 12 teams into the tournament. Twelve or 13 would likely put Texas Tech in the top three of the conference once again. Fourteen or 15 wins could have them challenging for a Big 12 title.
Again, I will update all of this as the season goes along. If Tech goes on a hot or cold streak, you’ll start to see their expected win total shift accordingly. And BPI updates with each data point and theoretically becomes more accurate as the season goes along.
Right now, the data says that Texas Tech is one of the best teams in the country, is poised for a strong run in the Big 12, and has a real chance to win more NCAA tournament games.