


I’m back with a recap of last week’s Big 12 gambling action. I realized last week that I probably didn’t do a good enough job of explaining everything, so I’ll try to do that here. I’ll explain “the system” (that I don’t actually gamble with, I just record hypothetical bets) column by column.
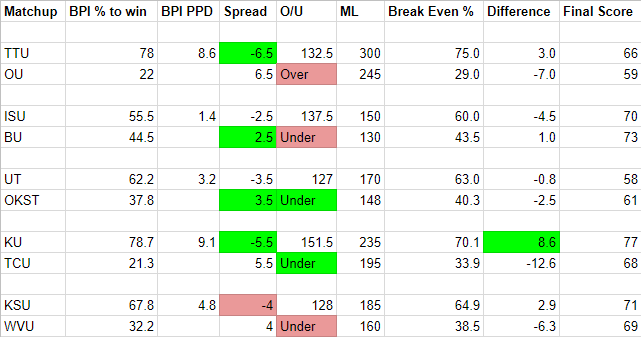
Like I do with Texas Tech’s season outlook each week, ESPN’s Basketball Power Index (BPI) is the starting point for how I pick games. BPI assigns each team a win probability, as well as a predicted point differntial (PPD). These are represented in the first two columns next to the matchups below. So betting against the spread is straightforward; find the spread, compare it to BPI’s PPD, and bet accordingly. So for example, BPI predicted Texas Tech would beat Oklahoma by 8.6 points last week. The spread was just Texas Tech -6.5, meaning BPI expected Texas Tech to cover the spread. I picked accordingly. Texas Tech won by 7 points, making it a winning bet, and therefore highlighted in green.
The next column is the points total for both teams in a game, referred to as the “over/under”, and labeled “O/U” on the chart. To choose how to bet on the over/under, I don’t use BPI. Instead, I bet against the public consensus in Las Vegas. I find this data using the Action Sports app. They track the percentage of money that has been bet, and I always choose against the majority of the public money in Vegas. The logic here is that Vegas sports books aren’t staying in business for very long if the public is betting accurately in the long run.
So sticking with the Texas Tech-Oklahoma game last week, the majority of the money in Vegas was for the points total to be under 132.5. I picked the over and lost, as the two teams combined for 125 points. The losing bet is highlighted in red.
The most complicated part of this is how to bet the money line in each game. The money line is listed next to the over/under. The number you see for the favorite in Vegas is the amount of money needed to bet in order to win $100. For the Texas Tech-Oklahoma game last week, one would need to bet $300 on Texas Tech to win the game straight up, regardless of point differential, in order to profit $100. The number you see in the money line column for the Vegas underdog is the amount of money one would profit on a $100 bet. For Oklahoma, that meant wagering $100 to profit $245.
What I do next is calculate – for both the favorite and the underdog – the win percentage needed for that bet to break even. In other words, if a team has even odds (bet $100 to profit $100), they would need to win 50 percent of the time for that bet to break even over the long haul. A team that is +200 (bet $100 to profit $200) would need to win 33.3 percent of the time, and so on. I calculated that at the given money lines in the Texas Tech-Oklahoma matchup, Texas Tech would need to win the matchup 75 percent of the time at -300 and Oklahoma would need to win 29 percent of the time at +245 to break even.
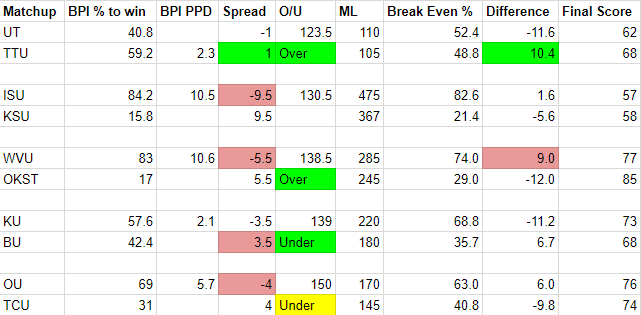
The next step is to compare that number (what I call the “break even percentage”) to the very first number on the chart – the BPI win probability – and bet (or don’t bet) accordingly. I do not bet unless there is a positive 7 percent difference in the break even percentage calculated above and the BPI odds to win. The “Difference” column is the difference between BPI’s win probability and the break even point at the given money line. So you’ll see on the chart below that Kansas would have needed to beat TCU 70.1 percent of the time for their moneyline of -235 (bet $235 to profit $100) to break even. Yet they were given a 78.7 percent chance to win the game per BPI, so I took the bet as that’s a difference of 8.6 percent in favor of Kansas.
The final score is listed on the far right so you can easily tally up the over/under and compare the margin of victory against the spread. Winning bets are green, losing bets are red, and pushes are yellow.
This week, against the spread bets went an even 5-5. This would result in an overall $45 loss on these 10 games (assuming a $100 bet on each game) since the bets pay out -110.
Combined with last week, we are at 12-6-1 against the spread for a profit of $492 year-to-date.
Over/under bets this week went 5-3-1 for a profit of $155. (The public was evenly split on the points total for Kansas State and Iowa State so no bet was made.)
Year-to-date we are at 10-7-1 on over/under bets for a profit of $210.
Money line picks this week paid out a profit of $47.50. After losing $50 on money line picks last week, we are basically even there.
So totals for all types of bets this week would have profited $157.50. Nothing earth-shattering, but not too shabby at all for a casual gambler seeking some added entertainment value during the college basketball season.
Year to date total profits for the season are at $689.50. For those who are new to gambling, this is where you cash out and never gamble again. But since we’re just having fun here and not wagering any real money, I’ll be back next week with another recap of how this system works.